![Battle of Bouvines and the flight of Hugh de Boves (1214). MS 16, f 37r[41]r.
Reproduced by permission of the Master and Fellows of Corpus Christi College, Cambridge.](images/cc-ms16f37r-HughdeBoves-480x143.gif "Battle of Bouvines and the flight of Hugh de Boves (1214). MS 16, f 37r[41]r.
Reproduced by permission of the Master and Fellows of Corpus Christi College, Cambridge.")


Technical background
One aspect of the Lands of the Normans project is to investigate the possible contribution that Information Technology could make to prosopographical research. The basic specification for the Lands of the Normans dataset is that it has to be able to store information relating to a sample set of people and places derived from a variety of different historical sources, each of which has its own characteristics, so that the relevant data for a particular person or place can be retrieved quickly. Furthermore it should accurately model the historical sources in order to enable the automated analysis of relationships between people and places. The Lands of the Normans dataset has been made available online, in the belief that it will both serve as a useful resource for historians and encourage further exploration of the potential of these tools.
- Principles of the database
- The data entry interface
- The practice of data entry
- Searching the database
- Genealogical tables
- Geographic Information Systems
- Conclusion
Principles of the database
The database was designed using an ontology editor, in this case Protégé-OWL. The purpose of an ontology is to describe the various concepts used in a document and how these concepts relate to each other. It is part of the wider idea of the semantic web as the next stage in the development of the World Wide Web (for more details about these concepts, see the original article by Tim Berners-Lee setting out the concept and a recent progress report). Currently, most content on the internet is expressed in natural language, such as English, which can be understood by a human but cannot easily be read by a computer. In the semantic web, documents are tagged or marked up so that they can be machine-read and analysed automatically. Since it would be difficult to design a 'one-size-fits-all' system of marking-up documents, a particular ontology is used to provide the key to interpreting a particular document.
For the Lands of the Normans project, the ontology was used to conceptualise the database and to define the different types of objects and the relationships between them. The data itself was stored in a relational database, using MySQL. The SQL (Structured Query Language) for the database was generated from the ontology. It would also have been possible to use a different format, such as XML (Extensible Mark-up Language), to store the data. The ontology was also used to create the XLST (Extensible Stylesheet Transformations) for the online interface, which is used to communicate between the user and the database. Finally, the ontology is also consulted when constructing searches of the database.
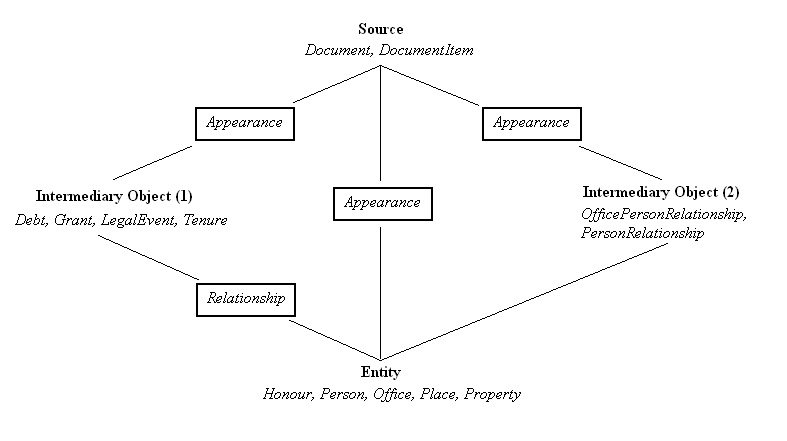
The Lands of the Normans database itself comprises a number of objects each of which represents what might be crudely termed a particular historical entity (such as a person or a place), or a historical statement, such as the description of a grant or of a familial relationship between two people. These objects are governed by a small number of basic rules.
First, every historical entity encountered in the sources should have a corresponding object in the database. For example, the historical person Ralph IV Taisson (d.1214) is represented in the database by Person object #183 and King John's letter patent of 23 November 1199 informing his local officers that Ralph and his tenants were quit of various dues and obligations is represented in the database by DocumentItem object #847. Moreover, every appearance of the same historical entity in the sources should be represented by the same object in the database.
Second, different types of historical entity are represented by different types of database object. For example, the people and places appearing in the historical sources are represented in the database by Person and Place objects respectively, and the historical sources themselves by Document and DocumentItem objects. Each type of database object contains a different set of information (or properties) in order to describe the historical 'object' that it represents. A Person object has properties to indicate the Surname, Forenames and Gender of the historical person it represents, as well as Description and Notes properties for further information and a unique identifying number.
Third, the database is relational, in that these objects are arranged and connected together in ways that represent the relationships between people and places in the historical sources. The database uses statements to model these relationships. There are currently six types of statement in the database: Debt, Grant, LegalEvent, OfficePersonRelationship, PersonRelationship and Tenure. The basic relationships between these objects are shown on the figure below.
^^ to the top
The data entry interface
The database is composed of a number of inter-related objects representing historical entities or statements. This means that the most convoluted document can be broken down into a number of individually simple relationships which can then be entered into the database. However, the extremely flexible structure of the database means that it would be extremely difficult for a researcher to enter data directly into the database. For this reason, an online data entry interface was created to guide the researcher through the process of entering data and to ensure that data was entered correctly.
The interface was designed to be accessible using a standard web browser. It consists of a number of forms, one for each type of object in the database. Each form contains text fields into which information about the object (its properties) was entered as well as buttons which serve to navigate from one object to another and to create linkages between objects. The interface itself converts the information entered by the researcher, either by typing text into the fields or by clicking on buttons, into SQL (the standard language of databases), using XLST transformations. The same interface could be used to produce XML. It is thus not necessary for the researcher to be familiar with the technicalities of SQL or XML in order to enter information into the database. The translated data is then sent to the server and inserted into the database. It should be noted that the interface is a means of communicating with the database and is not the database itself.
There are several advantages to using an online database. For example, every member of the project team was able to enter data and, importantly, any additions or revisions made by one researcher were immediately available to anyone else working on the database. This reduces the risk of duplication of effort. The structure of the Lands of the Normans database means that it is essential that all members of the team use the same objects to represent the same historical people and places. If different members of the team were working on their own databases it would be necessary to reconcile the various databases. This is particularly important for prosopographical research since the correct identification of people and places is vital. The use of an online data entry system also facilitates distance working or learning, as geographically-separated researchers can all work on the same database.
^^ to the top
The practice of data entry
There is no definitive list of Anglo-Norman families or of the properties that they held on which the Lands of the Normans project could be based. The solution adopted was to select a sample set of people and places and to trace these through the records in detail, while noting other appearances by Anglo-Norman landowners. This sample set was taken from the Rotulus de Valore Terrarum Normannorum incepto anno Regno Regis Johannis sexto (hereafter RVTN), a roll compiled by the English government in 1204 listing the estates in England confiscated from landowners who had chosen to remain in Normandy. This produced an initial sample of fifty-nine lay people and properties in 112 places.
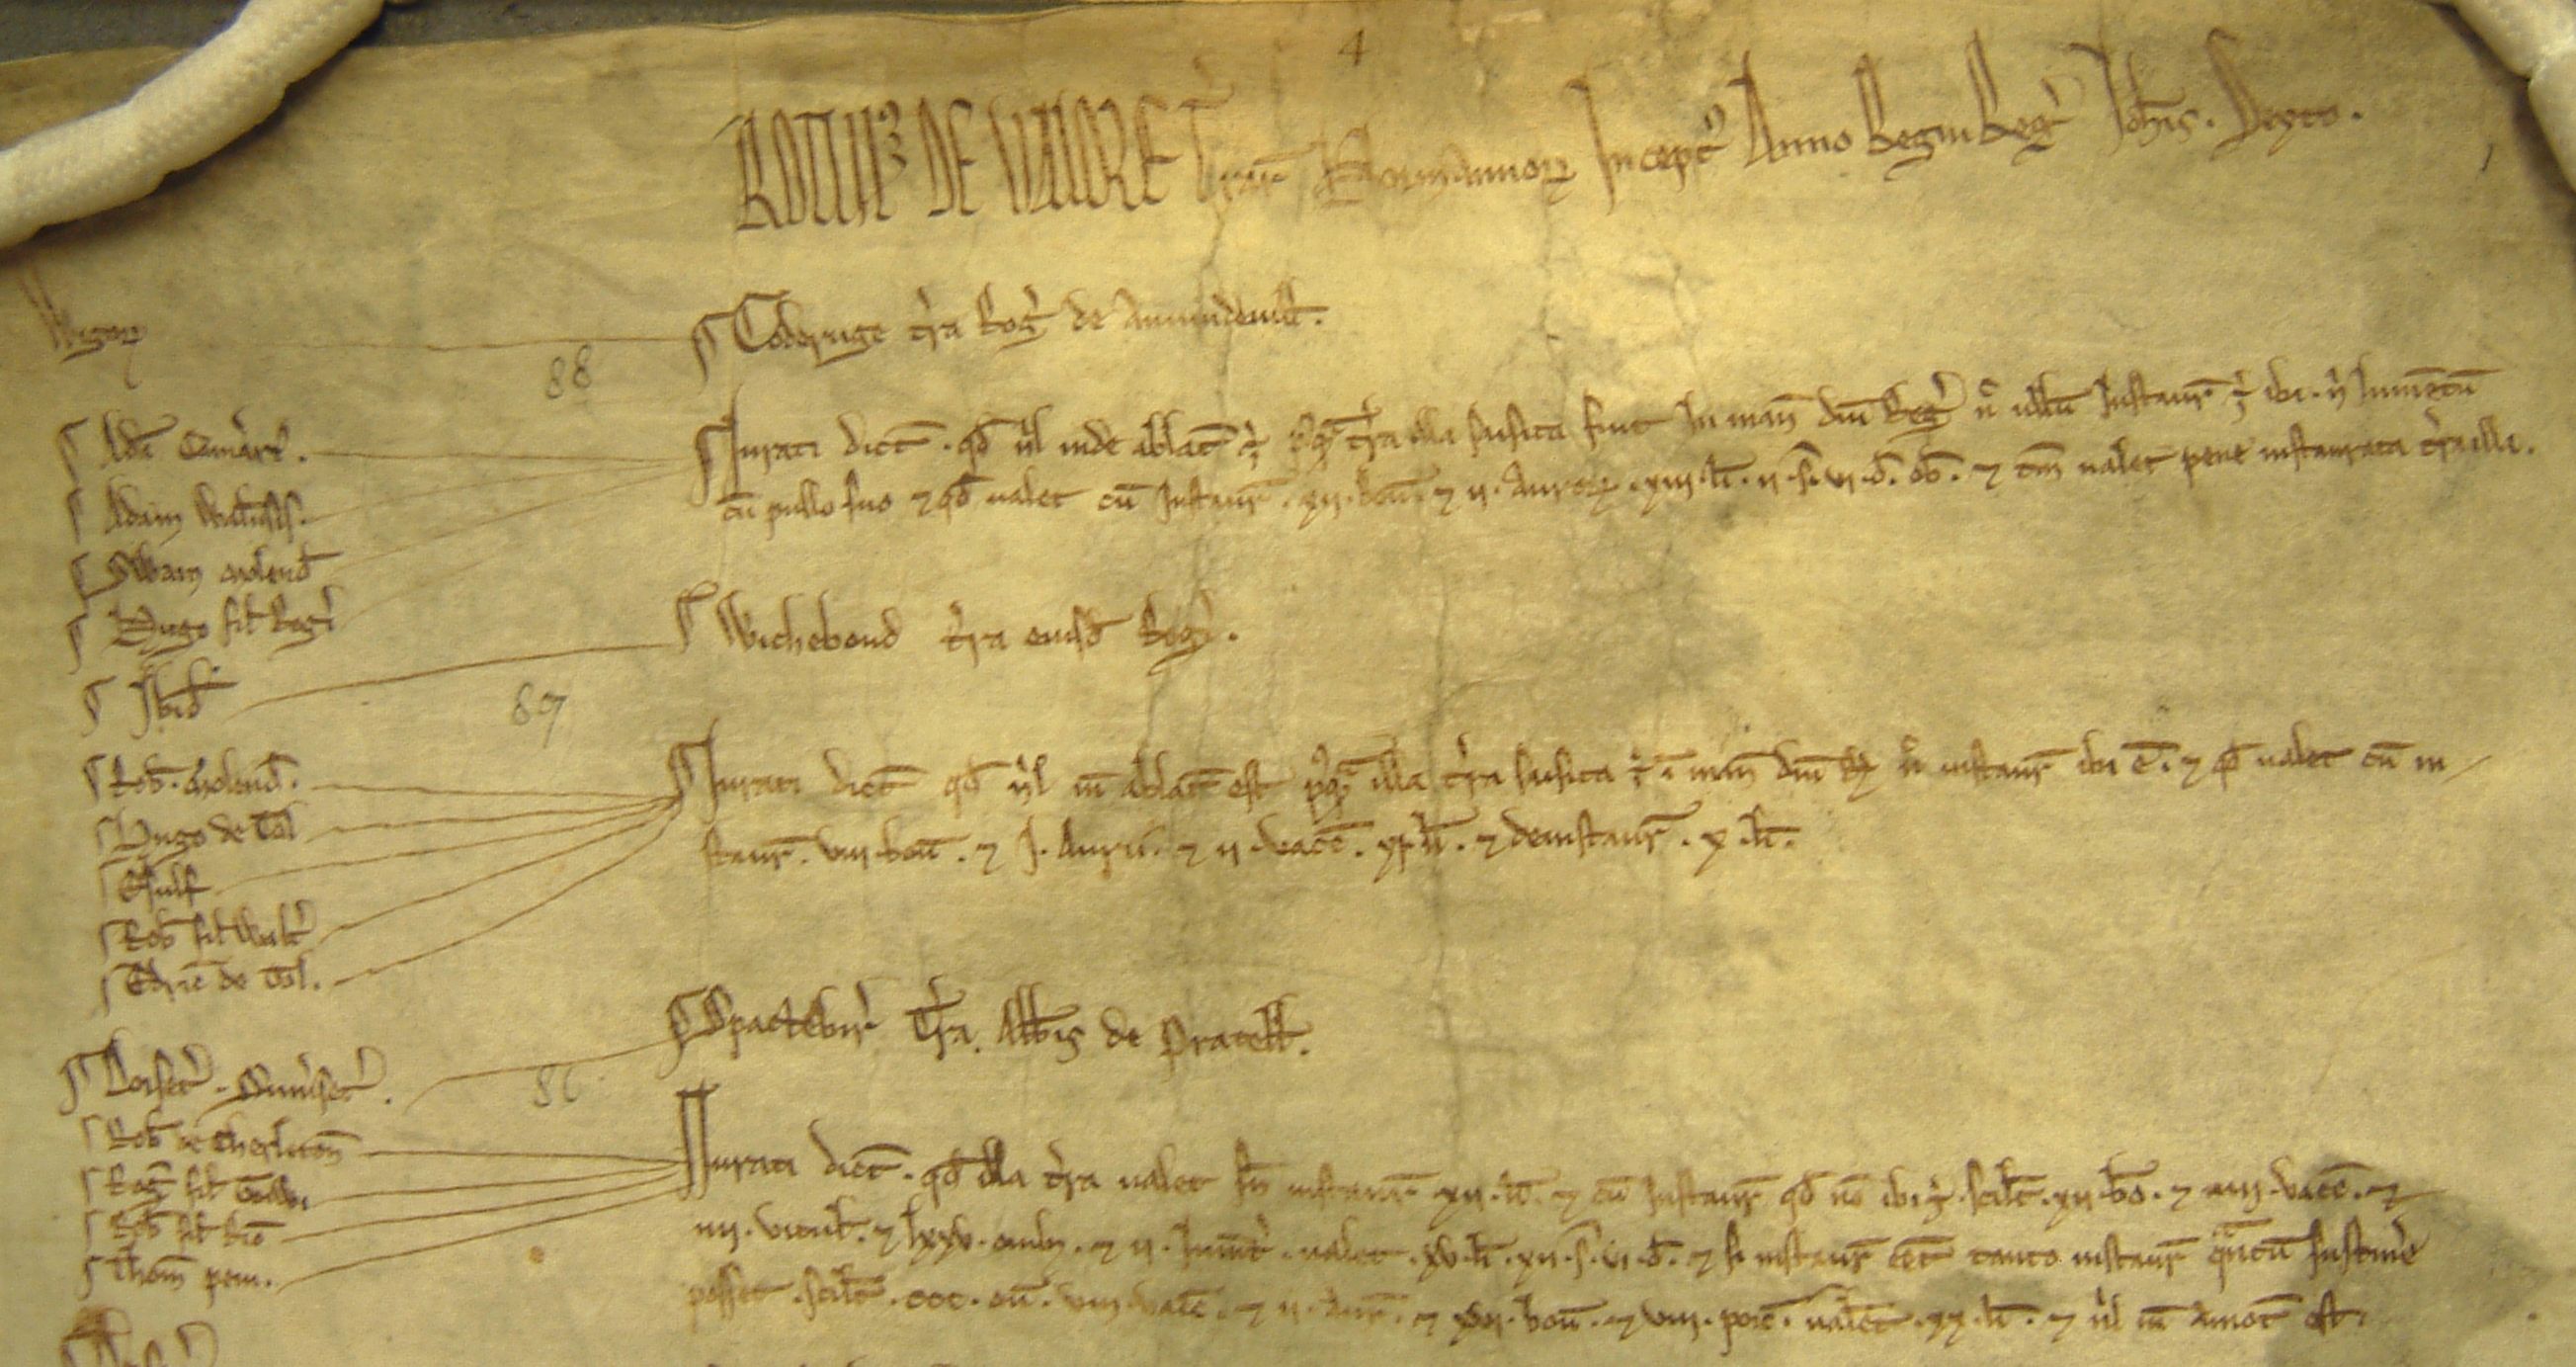
The RVTN sample group has been traced through most of the published English governmental records up to 1244, as well as several French sources. Any documents relevant to our sample were then entered into the database. It should be noted that the description of each document is only a brief English abstract of the source, intended to convey the general meaning as well as any specific details about people and places from our extended sample that appear in that source. This approach was adopted to maximise the amount of data that could be entered into the database within the time available and also to ensure that the database was intelligible to a non-specialist audience.
The central purpose of prosopography is to analyze the relationships between people, and this project has added a geographical element by including information about the relationships between people and places. The most important part of the data entry process is the identification of the people and places that appear in the sources. Ultimately, the identification of people and places requires the exercise of historical judgment. It does mean that the database is always subject to revision, in the same way that history as a whole is constantly being reinterpreted as new sources are found and old sources are read in new ways. This is facilitated by the design of the database, which made it possible to switch one person or place object for another as necessary.
The database is far from complete and will always be open to revision. For both these reasons, the project solicits any comments or suggestions about the identification of people and places and the interpretation of documents, or information about appearances by our sample group of people and places in other sources. These can be sent to the project team using the Feedback form (link)
^^ to the top
Searching the database
However, all the care taken when designing the database and entering data would be in vain if the user could not easily retrieve information about the people or places in which they are interested. This is complicated by the structure of the database. Although governed by a small number of simple rules defining the properties of objects and the connections between them, in practice the multiplication of objects and connections produces an immensely complex database. Furthermore, the flexibility of the database structure means there are a multiplicity of potential pathways by which objects can be connected together. The role of the search function is precisely to enable to user to find and organise relevant data.
The online input interface, used to enter data during the project, incorporated a flexible search-builder. All searches start with a given subject, potentially any object in the database but usually a person or place. The user then selects the end object of the search. For example, a frequent search would be to find all the DocumentItems in which a given person appears. In this example, the search-builder would use the ontology to deduce all the possible ways in which the two objects could be connected together. In this case, as can be seen from the above diagram, a person could be directly connected to a DocumentItem by an Appearance object, or indirectly as part of a statement (for example, as a witness to a grant). The search-builder then creates the necessary queries in SQL to search the database itself. These queries are then submitted to the database and the results are ordered and displayed.
The flexible search builder was a powerful tool which enabled the user to explore the connections between data. However, it required an understanding of how the data was connected within the database to create searches which had any meaning or produced any results. Conversely, it also often produced too many results, particularly because there were potentially an extremely large number of ways to connect one item of data to another - for example, a person might be directly related to a grant, but he might also be connected to another person who was connected to a grant or he might be connected to debt which was associated with a place which was connected a grant. How many of these connections were meaningful? How should the search builder know when to stop searching? Increasingly the project team discovered that restricting the search was as important as providing flexibility, and it was very difficult to restrict the search when the results were so varied, and the connections so complicated. Another issue became that, as the search was created at the request of the user, it was possible for the user to request searches that were very complicated, involving many joins across tables which adversely affected performance.
In designing the search functionality for the publicly available "Lands of the Normans" website, several requirements were identified:-
- The user should be navigated through the connections between objects in a meaningful way.
- The user should be able to quickly perform meaningful searches and produce a limited number of meaningful results.
- The searches should produce results in a timely fashion.
From the outset, the project was conceived as being concerned primarily with places (the "Lands") and people ("of the Normans"), so it was decided that the most appropriate way to guide the user through the database structure was to allow them to search either people or places and then to allow them to view objects associated with a person or place. The user begins by searching for a person or a place, or browsing all people or places. When the user has identified a person or place that they are interested in, they can explore the information relating to that person. For example, clicking on the "Appearances" link will provide information about where there are connected references to the person or place in the documents. Clicking on the "Details" link for a person or place will provide all the information specific to that person or place, allow the user to identify all other places or people associated with that person or place, and view all the other associated objects (such as Debts, Grants). Alternatively the user can click on the "People" link to explore all people associated with a place or the "Places" link to explore all places associated with a person. In addition, searching for a person presents the user with one further option. Clicking on "Family" allows the user to view details of that's person genealogy. The performance of the search was improved, both by restricting the ways in which users could search and navigate the data and also by simplifying the database so that fewer joins were required.
^^ to the top
Genealogical tables
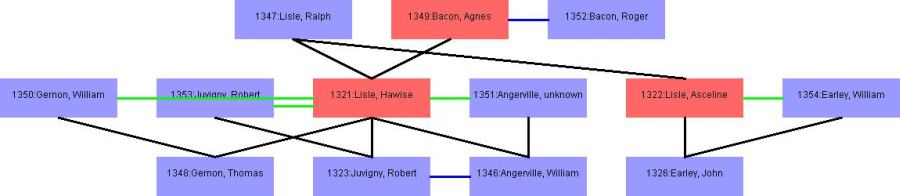
The Family search allows for the automated reconstruction of genealogical tables. This is done using a modified version of the standard person-to-associated-people search. This first identifies all the other person objects to which the subject is connected by a familial relationship. However, the family search is recursive, that is to say that it does not stop with the people directly connected with our subject, but also searches for all people connected to those people and so on until it reaches a dead end. All the resulting person-person relationships are then displayed in a table. This is then used to build a simple graphical display showing all these family relationships. The display is constructed according to a system of fairly simple rules. The person-person relationships are indicated by lines joining the two person objects involved and different types of relationships are represented by different coloured lines. Each generation is placed on a different level, so that parents are one level above their children and grandparents two levels above their grandchildren while siblings and spouses are shown on the same level.
The graphical display is visually quite different from
traditional family trees. This is because the database only records those definite statements about family
relationships recorded in the sources, as well as further relationships that can be logically deduced from these
relationships. These provide the basic skeleton of the family tree but they exclude some of the extra information
that the historian can infer rather than deduce from the sources and their knowledge of medieval society. For example,
the automatically-generated family tree for the Hommet family
Creating and drawing the family trees highlighted a number of the challenges inherent in this speculative project. The aim was to search the data and present the results in a meaningful way to the end user. However, as with the automated search builder, it proved difficult to establish where the family tree should stop. This often provided the user with a fuller, but much more complex, family tree than anticipated. Traditionally, family trees have often constrained themselves by focusing on a vertical pathway from father to grandfather, whilst placing little emphasis on the horizontal. Each level may contain some siblings, but it is unusual for the siblings descendants to feature fully in the tree. Dynamically generating the family tree caused all these relationships to be included, which in turn, made automatically determining the layout a complex task. The problem, which occurs throughout the project, is how to present a complex dataset in a way that the user can easily comprehend. To construct the graphical display of the tree, algorithms relating to the Travelling Salesman problem were adapted - people were seen as the nodes, and relationships as the paths between these nodes, and the nodes were systematically shuffled until there were as few path crossovers as possible. A further complication encountered when constructing the family tree was that, in a complicated dataset, some information was missing, some appeared to conflict, and some was almost certainly incorrect. Whilst the family tree display could benefit from further refinement, it is an interesting example of displaying textual data in a graphical form and of how established algorithms can be applied to historical data to assist interpretation.
^^ to the top
Geographic Information System (GIS)
!--- The map functionality is no longer available on the Lands of the Normans website ---!
Geographical Information Systems (GIS) is a software technology allowing data to be presented and analysed in a spatial context. GIS originated in the computational advances of the 1950's and 60's but today, GIS software has transcended its roots in mainframe and mini-computing and is available on desktop computers. Similarly the data that can be utilised for GIS systems has become increasingly sophisticated -a plethora of different sensor platforms and data capture mechanisms have enhanced the range of data that can be subject to GIS analysis.
The prerequisite of a GIS system is a basic set of geographic data that can be associated with the project data. This poses certain difficulties for the current project, since the Middle Ages predated the emergence of geography as a mathematical science and any formal cartographic methodology and there have been significant changes across the landscape during the intervening centuries. However, there was also considerable continuity of named features, particularly of parish boundaries, and these been used to link the medieval and modern worlds. The historical county and parish boundaries for England and Wales, as recorded in 1851, are available in the EDINA UK BORDERS dataset. The UK BORDERS dataset contains geographic data in vector format as a set of polygons, as well as metadata, such as place names and parent county and a unique identifying number. This metadata was used to create a Parish object in the project database, which could then be related to the existing place objects. A query was written that linked the place objects in the database to the appropriate Parish objects. This meant that places in the database were associated with the vector data for the equivalent parish and thus could be displayed on a map. In practice the parish polygons were replaced with points representing the central coordinates of a given parish. Unfortunately there was neither the time nor the data to provide a similar implementation for the communes in Normandy that also appear in our database.
There are several ways in which geographic data can be displayed online. A typical approach is to produce a static graphical image of the map. Interaction with the map can be achieved by placing html hotspots that anchor the features to particular pages or responses. This project has followed a different approach and uses a 'Web Map Service' (WMS). A WMS system is in essence, a limited web capable GIS platform. The software permits map layers created by a GIS package to be viewed within a web browser. This type of application provides additional key advantages, such as the ability to create simple bi-directional queries, dynamic interaction with the map (such as the ability to zoom in and out) and the ability to mix different map layers. The basic map is shown on the screenshot below.
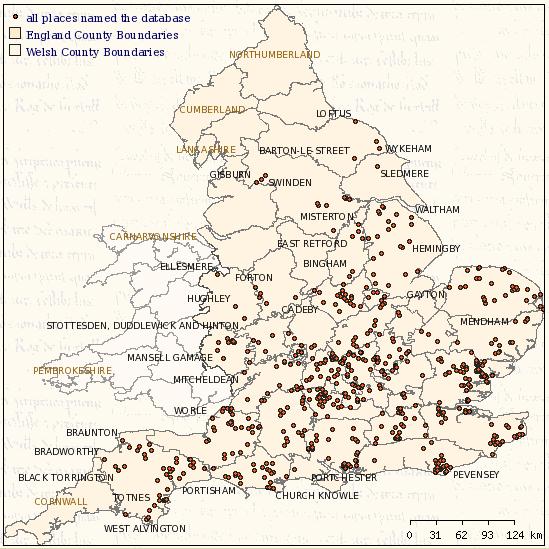
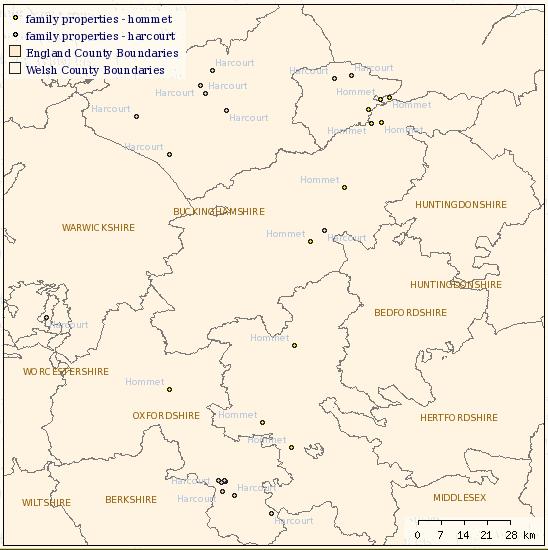
At the moment, the GIS interface only works in one direction. It is possible to query the database from the map by clicking on (while holding the control and shift keys) a highlighted point on the map. This will open a new browser window giving brief details about the place selected and from here it is possible to enter the database itself and run searches based on this place. The map can thus be used as a gateway to the database. It was hoped to include bi-directional queries where the results of one or more searches of the database could be displayed as map layers. For instance, the geographical distribution of the estates of two or more people could be compared. Some indications of the potential of this tool can be gleaned from the map layers for particular families that can be selected on the project map. These layers were created from queries run on the database but it was not possible to incorporate a generic map layer from a query. The screenshot below shows map layers for the Harcourt and Hommet families.
^^ to the top
Conclusion
The system developed during the Lands of the Normans project. It is extremely flexible and the basic concepts used in the database can describe most kinds of medieval sources. The use of an online data entry system means that it is possible to customise the interface to suit the type of historical source being used and the aims of the project, and that the historical researchers do not need to be familiar with computer languages such as SQL (or XML). At the same time, the database is able to assign meaning in a retrievable format, thereby enabling automated reconstructions of genealogical tables and the mapping of data. The information in the database can be readily updated and revised as new sources are uncovered or old identifications of people and places are revised. There is also the potential to involve a wider historical community in the development of the dataset, which can therefore serve as a new kind of forum for historical discussion. The modish comparisons would be with Wikipedia or Web 2.0 but it could also be seen as a return to an earlier era of historical scholarship such as the discussions of the Society of Antiquaries in the sixteenth and seventeenth centuries or even the debates in the early years of the English Historical Review.
